The World Population
Current population
The world current population is 7 billion of individual .
Rates
Rates are often used, instead of absolute numbers, to determine how frequently a population or demographic event is occurring — rates show how common an event is. Rates also make it possible to compare countries that vary greatly in terms of population size.
Crude birth rate*
The region who have the highest CBR is Middle Africa (44 per 1,000 of people).The region who have the lowest CBR is Southern Europe (9 per 1,000 of people).
Crude death rate*
The region who have the highest CDR is Middle Africa (15 per 1,000 of people).The region who have the lowest CDR is Central America and Western Asia (5 per 1,000 of people).
Infant Mortality rate*
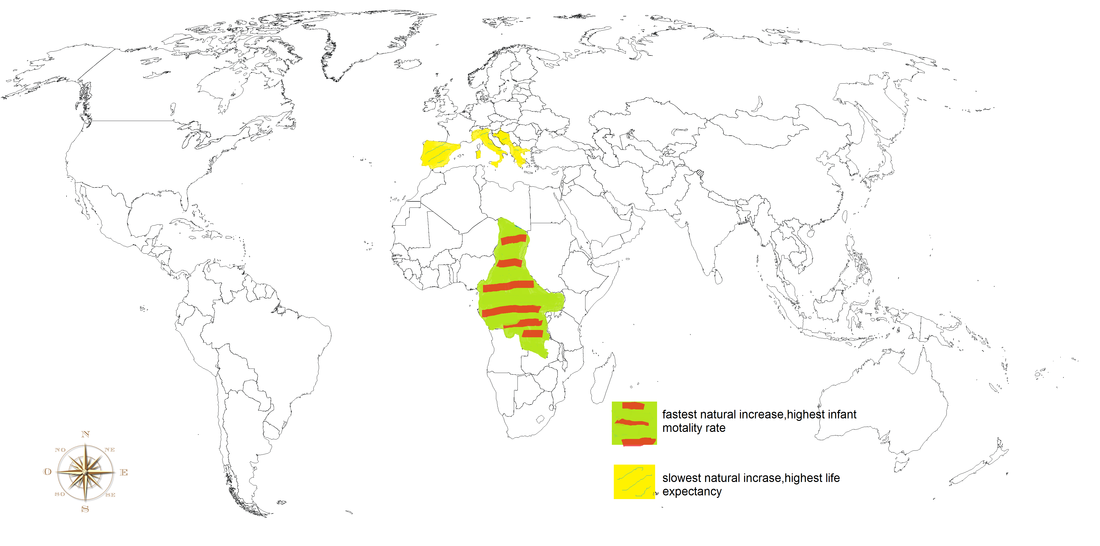
The region who have the highest infant mortality rate is Middle Africa (100 per 1,000 of live birth).The region who have the highest infant mortality rate is Western Europe (3 per 1,000 of live birth).
Total fertility rate*
The region who have the highest TFR is Middle Africa (6.1).The region who have the lowest TFR is Southern Europe (1.4).
Natural Increase rate*
The region who is growing the fastest through natural increase is Middle Africa (3.0%).The region who is growing the slowest through natural increase is Southern Europe (0.0%).
Population Pyramids
The age and sex structure of a population refers to the number or proportion of males and females who are in each age category. Age-sex structure tells us about a population’s past trends in fertility, mortality, and migration. It also provides information about the population’s potential for future growth. The greater the proportion of people in the younger-adult age groups,the greater the potential for more births and population growth.
Dependency ratio*
The region who have the highest youngest proportion of population is Middle Africa (45%).The region who have the highest oldest proportion of population is Southern Europe (19%).
Life expectancy*
The region who have the expected to live longest is Western Europe (81%).The region who have the lowest life expectancy is Middle Africa (51%).
Urban Areas
Africa: Algeria (73%)
Asia: Singapore (100%) Latin America: Puerto Rico (99%)
Europe: Malta (100%) Oceania:Nauru (100%)
GNI PPP/capita*
The first region who is the wealthiest in term of GNI PPP/capita is Northern America (49,800$).The second region who is the wealthiest in term of GNI PPP/capita is Western Europe (40,470$).The poorest two region in term of GNI PPP/capita is Eastern Africa (1,190$).
Vocabulary
Current population
The world current population is 7 billion of individual .
Rates
Rates are often used, instead of absolute numbers, to determine how frequently a population or demographic event is occurring — rates show how common an event is. Rates also make it possible to compare countries that vary greatly in terms of population size.
Crude birth rate*
The region who have the highest CBR is Middle Africa (44 per 1,000 of people).The region who have the lowest CBR is Southern Europe (9 per 1,000 of people).
Crude death rate*
The region who have the highest CDR is Middle Africa (15 per 1,000 of people).The region who have the lowest CDR is Central America and Western Asia (5 per 1,000 of people).
Infant Mortality rate*
The region who have the highest infant mortality rate is Middle Africa (100 per 1,000 of live birth).The region who have the highest infant mortality rate is Western Europe (3 per 1,000 of live birth).
Total fertility rate*
The region who have the highest TFR is Middle Africa (6.1).The region who have the lowest TFR is Southern Europe (1.4).
Natural Increase rate*
The region who is growing the fastest through natural increase is Middle Africa (3.0%).The region who is growing the slowest through natural increase is Southern Europe (0.0%).
Population Pyramids
The age and sex structure of a population refers to the number or proportion of males and females who are in each age category. Age-sex structure tells us about a population’s past trends in fertility, mortality, and migration. It also provides information about the population’s potential for future growth. The greater the proportion of people in the younger-adult age groups,the greater the potential for more births and population growth.
Dependency ratio*
The region who have the highest youngest proportion of population is Middle Africa (45%).The region who have the highest oldest proportion of population is Southern Europe (19%).
Life expectancy*
The region who have the expected to live longest is Western Europe (81%).The region who have the lowest life expectancy is Middle Africa (51%).
Urban Areas
Africa: Algeria (73%)
Asia: Singapore (100%) Latin America: Puerto Rico (99%)
Europe: Malta (100%) Oceania:Nauru (100%)
GNI PPP/capita*
The first region who is the wealthiest in term of GNI PPP/capita is Northern America (49,800$).The second region who is the wealthiest in term of GNI PPP/capita is Western Europe (40,470$).The poorest two region in term of GNI PPP/capita is Eastern Africa (1,190$).
Vocabulary
- The crude birth rate (CBR) is the annual number of births per 1,000 population.
- The crude death rate (CDR) is the annual number of deaths per 1,000 population.
- The natural increase rate is the percentage growth of a population in a year , computed as the crude birth rate minus the crude death rate.
- The infant mortality rate measures the number of deaths each year to infants under one year of age per 1,000 live births.
- The total fertility rate (TFR) is the average number of children a woman would have if she maintained today’s level of childbearing throughout her reproductive years.
- The dependency ratio is the number of people under the ag of 15 and over age 64 compared to the number of people active in the labor force.
- The life expectancy is the average number of years an individual can be expected to live given current social economic, and medical conditions .Life expancy at birth is the average number of years a newborn infant can expect to live.
- Gross national income in purchasing power parity per capita (GNI PPP/capita) converts income into "international dollars" and indicates the amount of goods and services one could buy in the United States with a given amount of money.